The U.S. Census Bureau released data on various parts of the economy, and it shows that the percentage of Americans who live in poverty is as high as it was back in 1993:
** The poverty rate in 2010 was the highest since 1993 but was 7.3 percentage points lower than the poverty rate in 1959, the first year for which poverty estimates are available. Since 2007, the poverty rate has increased by 2.6 percentage points.** In 2010, the family poverty rate and the number of families in poverty were 11.7 percent and 9.2 million, respectively, up from 11.1 percent and 8.8 million in 2009.
** The poverty rate and the number in poverty increased for both married-couple families (6.2 percent and 3.6 million in 2010 from 5.8 percent and 3.4 million in 2009) and female-householder-with-no-husband-present families (31.6 percent and 4.7 million in 2010 from 29.9 percent and 4.4 million in 2009).
At what does it take to be classified as living in poverty?
As defined by the Office of Management and Budget and updated for inflation using the Consumer Price Index, the weighted average poverty threshold for a family of four in 2010 was $22,314.
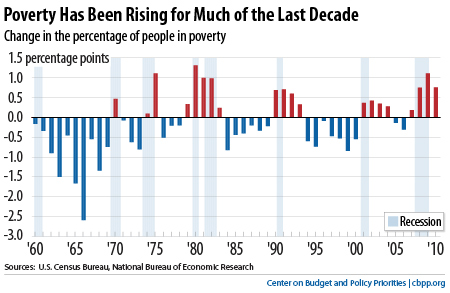
The fact of the matter is, though, that poverty has been rising in America for much of the past decade, as the following chart illustrates:
It's very clear that the number of Americans in poverty increases under Republican presidents dating back to Ronald Reagan. Is that a coincidence?
Permalink to post: http://www.cslproductions.org/money/talk/archives/001235.shtml
Receive an email whenever this MONEY blog is updated: Subscribe Here!
Tags: Census Bureau, hunger, poverty, povery line
home | music | democracy | earth | money | projects | about | contact
![]() Site design by
Matthew Fries | ©
2003-23 Consilience Productions. All Rights Reserved.
Site design by
Matthew Fries | ©
2003-23 Consilience Productions. All Rights Reserved.
Consilience Productions, Inc. is a 501(c)(3) non-profit organization.
All contributions are fully tax deductible.


![]()