Just in time to bolster the claims of the Occupy Wall Street movement, the Congressional Budget Office recently published a report showing how great the income disparity has become since 1979:
After-tax income for the highest-income households grew more than it did for any other group. (After-tax income is income after federal taxes have been deducted and government transfers—which are payments to people through such programs as Social Security and Unemployment Insurance—have been added.)CBO finds that, between 1979 and 2007, income grew by:
** 275 percent for the top 1 percent of households,
** 65 percent for the next 19 percent,
** Just under 40 percent for the next 60 percent, and
** 18 percent for the bottom 20 percent.
This chart says it all:
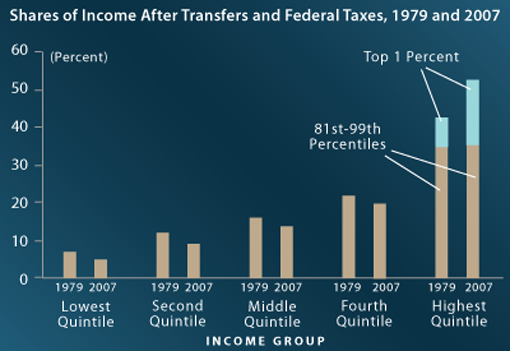
And these statistics are particularly troublesome:
The share of income going to higher-income households rose, while the share going to lower-income households fell.** The top fifth of the population saw a 10-percentage-point increase in their share of after-tax income.
** Most of that growth went to the top 1 percent of the population.
** All other groups saw their shares decline by 2 to 3 percentage points.
You can read this very important study in .pdf form here: "Trends in the Distribution of Household Income between 1979 and 2007"
Permalink to post: http://www.cslproductions.org/money/talk/archives/001245.shtml
Receive an email whenever this MONEY blog is updated: Subscribe Here!
Tags: CBO, Congressional Budget Office, income disparity, income inequality
home | music | democracy | earth | money | projects | about | contact
![]() Site design by
Matthew Fries | ©
2003-23 Consilience Productions. All Rights Reserved.
Site design by
Matthew Fries | ©
2003-23 Consilience Productions. All Rights Reserved.
Consilience Productions, Inc. is a 501(c)(3) non-profit organization.
All contributions are fully tax deductible.


![]()