Remember the Hockey Stick graph which shows unprecedented global warming over the past few decades relative to centuries past?
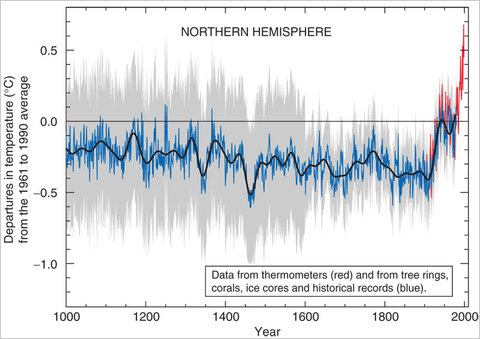
First unveiled in 1998 by the paleoclimatologist Michael Mann, the graph became an icon of global warming after it was featured in the summary of a crucial report by a United Nations climate panel from 2001. A version also appeared in the documentary "An Inconvenient Truth."The validity of Dr. Mann’s graph has been under attack by climate skeptics ever since, with some contrarians going so far as to claim that data was deliberately manipulated or omitted to produce its signature shape.
(A 2006 report by the National Research Council endorsed most, but not all, of Dr. Mann’s findings, which he later refined.)
There is new news to update this "controversial" graph:
Two new studies bolstering the "hockey stick" hypothesis were published just recently. One that appeared this month in the journal Geophysical Research Letters analyzed seashell deposits on the North Atlantic seafloor and determined that 20th-century warming in the region "had no equivalent during the last thousand years."Another study, in The Journal of Geophysical Research, analyzed ice cores from glaciers in the eastern Bolivian Andes dating back to 400 A.D.
"The last decades of the past millennium are characterized again by warm temperatures that seem to be unprecedented in the context of the last 1,600 years," the researchers concluded.
You can't kill a good (and accurate) hockey stick!
Permalink to post: http://www.cslproductions.org/earth/talk/archives/001077.shtml
Receive an email whenever this EARTH blog is updated: Subscribe Here!
Tags: climate change, global warming, hockey stick graph, Michael Mann
home | music | democracy | earth | money | projects | about | contact
![]() Site design by
Matthew Fries | ©
2003-23 Consilience Productions. All Rights Reserved.
Site design by
Matthew Fries | ©
2003-23 Consilience Productions. All Rights Reserved.
Consilience Productions, Inc. is a 501(c)(3) non-profit organization.
All contributions are fully tax deductible.


![]()